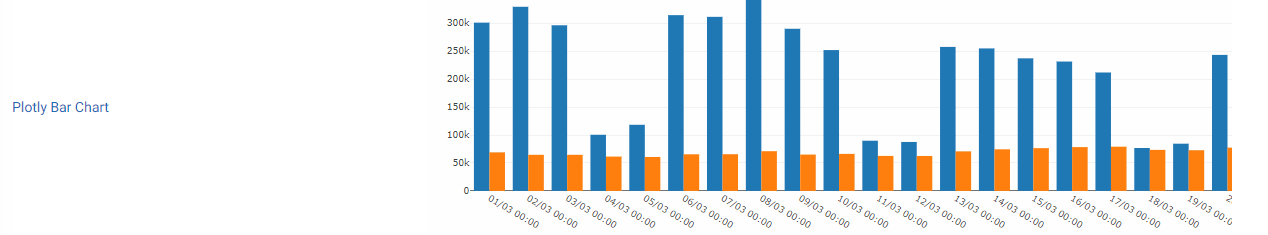
Bar Line Chart
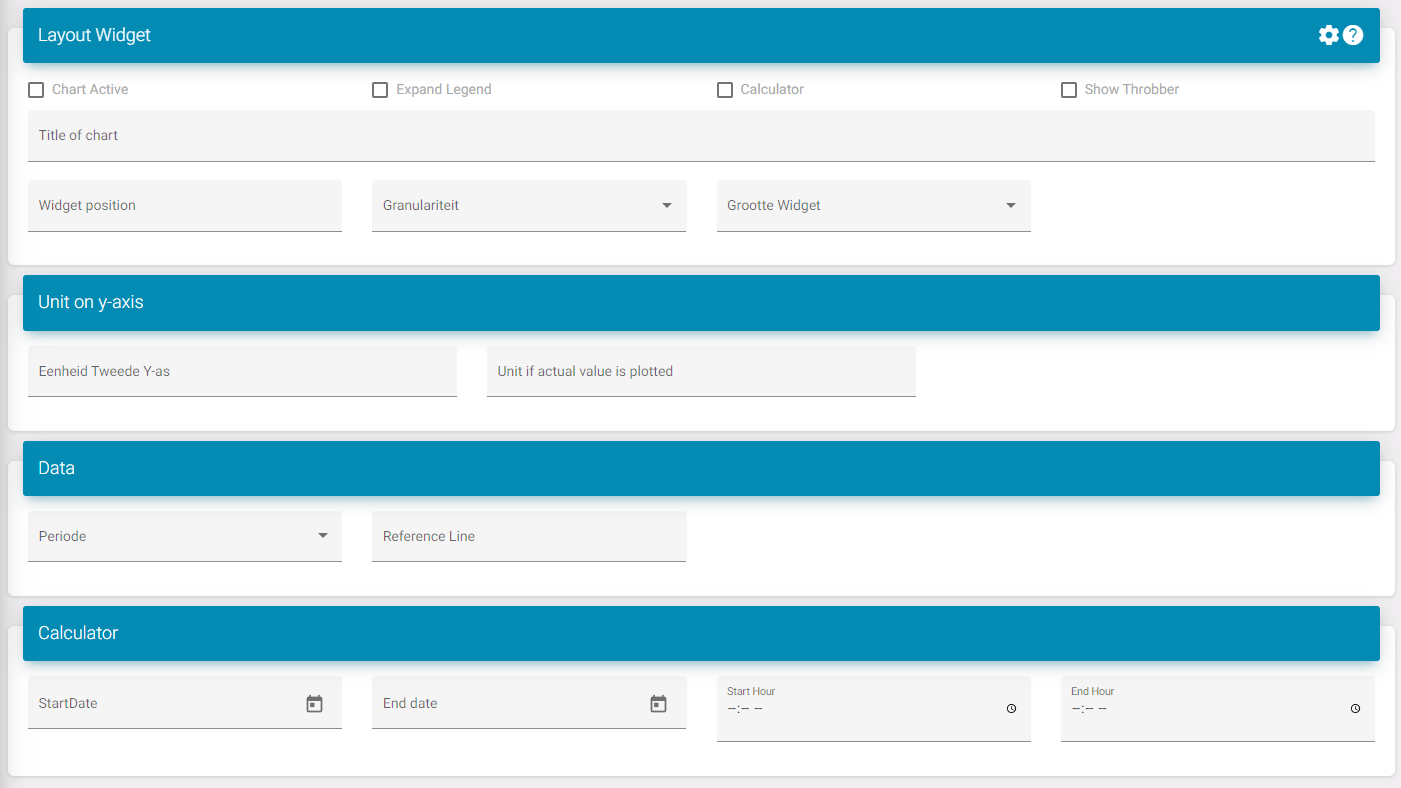
Settings
Chart active: Activates the widget in the dashboard.
Expand legend: This increases the space underneath the widget allowing more datapoint to be visible without a scroll bar.
Show throbber. You can turn this on if you want to see the loading icon when new data is sent to the portal.
Title: This is the title of the widget.
Widget position: This is the position of the widget in the list on the dashboard.
Widget size: This is if you want to see multiple widgets next to each other.
To know what to select you need to see the dashboard as 12 divisions. Here is a list to see how much divisions a size takes:
-
XXL: Full size/ standard; 12/12
-
XL: 10/12
-
L: 8/12
-
M: Half; 6/12
-
S: 4/12
-
XS: 2/12
Period: Select what the standard period is when the dashboard is loaded. Ex. Month so when you open the dashboard you don't need to edit it so it shows data for a month.